


The best-performing Nifty Indices
in nine charts
NSE has a ton of equity indices, 96 of them. Removing a bunch of the repetitive ones, we are still left with over 50. Chart below shows their CAGR since inception. All the way from 23% (Midcap150 Momentum50) to -3% (Realty). The Nifty has clocked 14% over 24 years.

Worst drawdowns. Realty fell 93% from peak, IT *gasp* 90% from March 2000 to Oct 2001.

CAGR calculations assume you invest on inception date and never again. So we also see how a monthly SIP would’ve done in each of those indices. The worst 3 SIP performers: Media, High Beta 50 and Realty The best 3: Midcap150 Momentum 50, Alpha 50, Smallcap250 Quality 50.

Chart shows the difference between SIP XIRR and CAGR. A look at the Realty index chart highlights why the CAGR is so much worse than what a monthly SIP would’ve done.


How the various indices did versus the Nifty on SIP XIRR and Volatility.
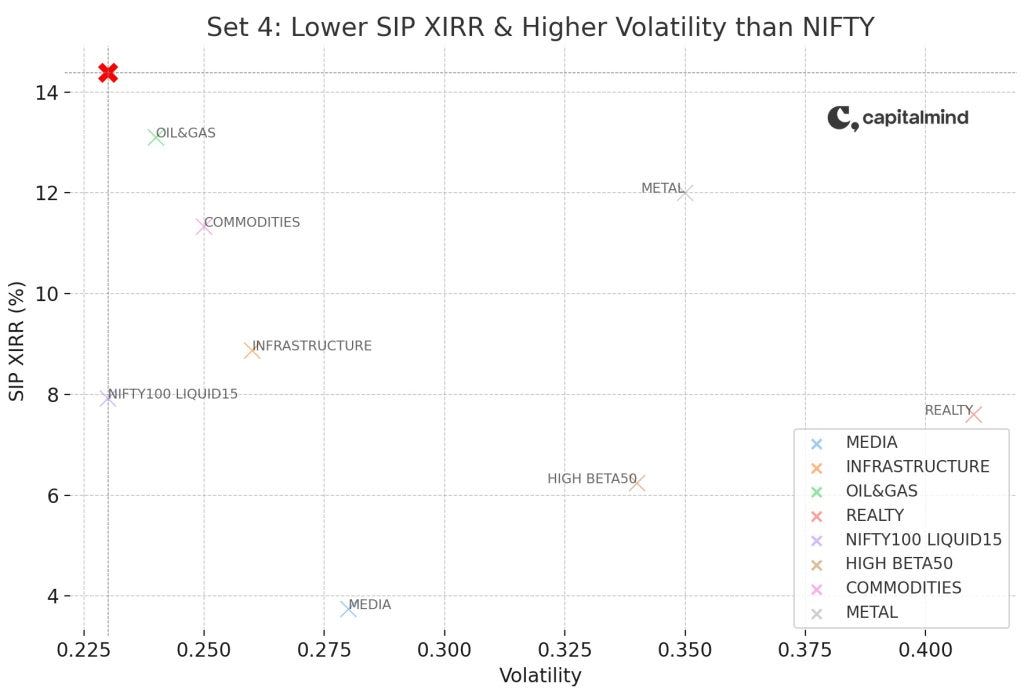
4: Worse than the Nifty on both return and volatility (Red ‘X’ marks the Nifty)
Media
Infrastructure
Oil & Gas
Realty
Nifty100 Liquid15
High Beta 50
Commodities Metal
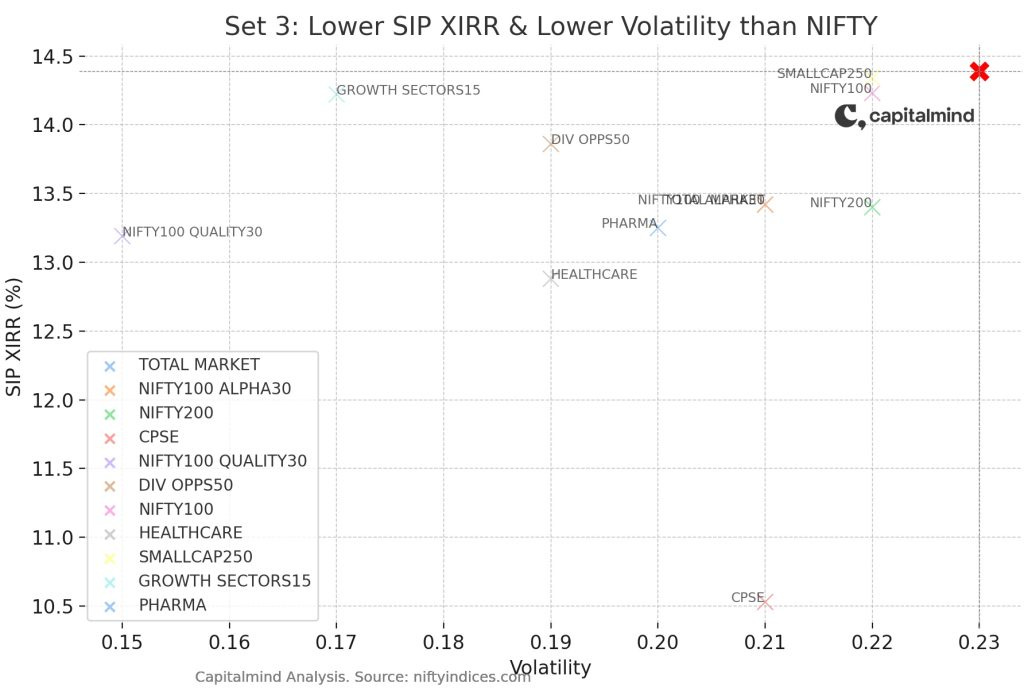
Lower return than the Nifty, but also lower volatility Nifty
Total Market
Nifty 100 Alpha 30
Nifty 200
CPSE
Nifty100 Quality30
Dividend Opportunities 50
Nifty 100
Healthcare
Smallcap 250
Growth Sectors 15
Pharma
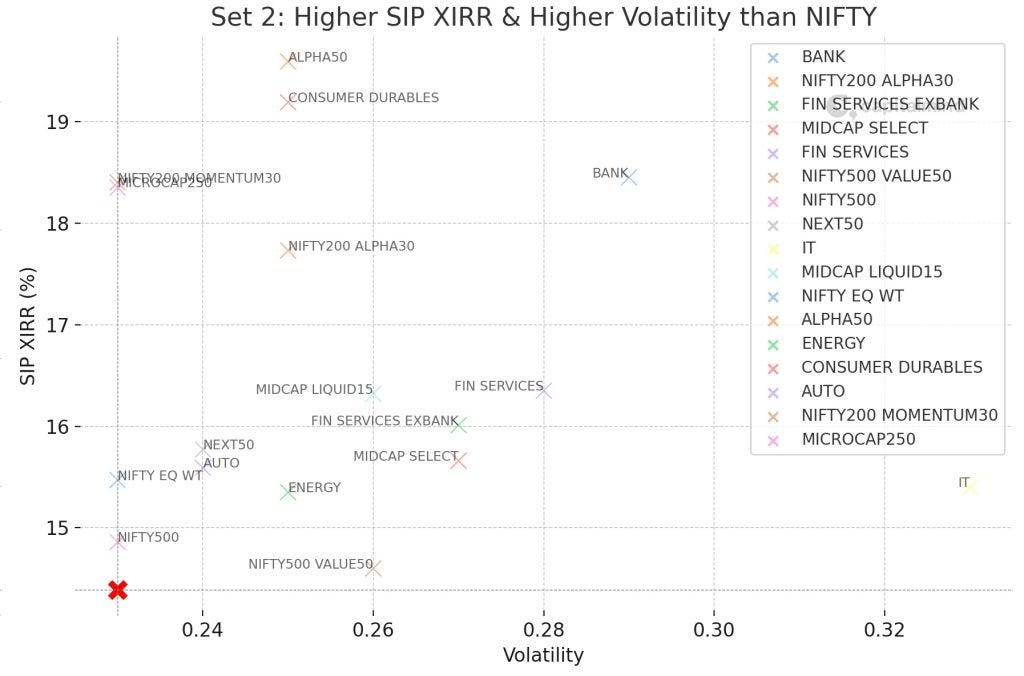
Higher SIP return but also higher volatility
Nifty Bank
Nifty 200 Alpha 30
Fin Services ex-Bank
Midcap Select
Fin Services
Nifty 500 Value 50
Nifty 500
Next 50
IT
Midcap Liquid 15
Nifty Equal Wt.
Alpha 50
Energy
Consumer Durables
Auto
Nifty 200 Momentum 30
Microcap 250
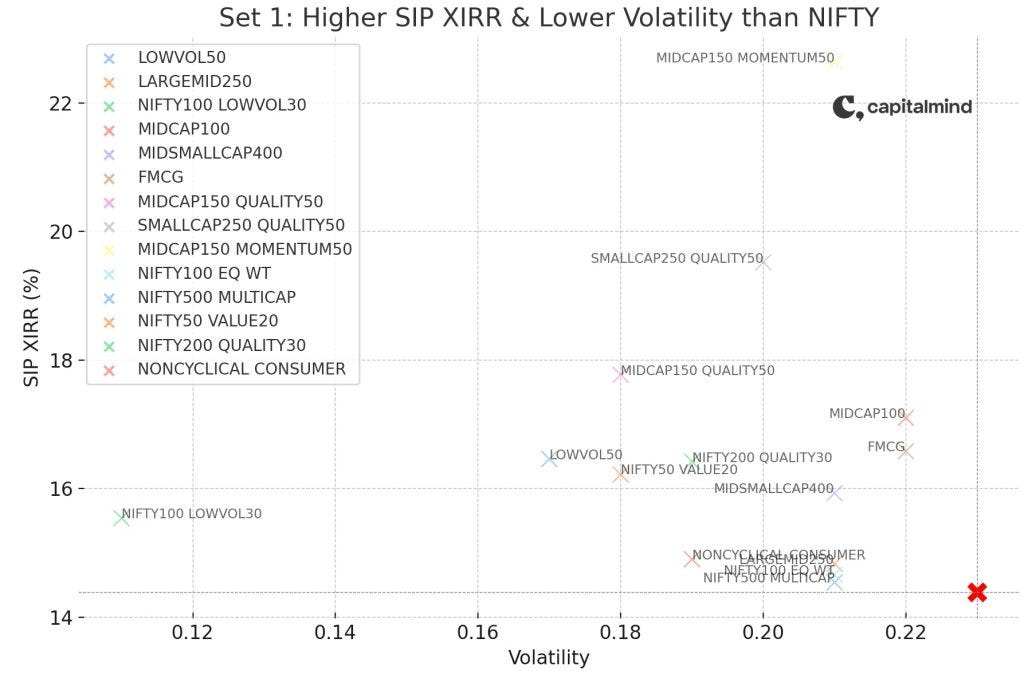
Higher SIP return and Lower Volatility than the Nifty
LowVol 50
LargeMid 250
Nifty100 Low Vol 30
Midcap 100
MidSmall 400
FMCG
Mid150 Quality50
Small250 Quality50
Midcap150 Momentum 50
Nifty100 Equal Wt.
Nifty500 Multicap
Nifty50 Value 20
Nifty200 Quality 30
Noncyclical Consumer
Caveats when drawing conclusions from index data:
Inception dates of the various indices compared are different, some go back to 1995, others to 2005, still others have later inception dates. The “youngest” index in this comparison is Nifty100 Liquid15, with an inception date in 2010. This could make an index look better or worse than it would had it been around for a longer duration.
We found (many) issues with niftyindices.com data. Garbage values, repeated dates and a few others. We corrected most, but possible some slipped through here.
Index inception dates are not publish dates. Most NSE indices were published only recently, presumably the ones that backtested well. This means some indices probably look good only with the benefit of hindsight.
Not all indices are consistently investable, The Alpha50 index is one such example where the Kotak Alpha 50 ETF struggled to add one of the constituents of the index due to lack of liquidity as the stock hit upper circuits before it turned around and started doing the same thing on the way down. So, a high “model” index return is not actual return.
Follow @CalmInvestor on Twitter